Tuesday, March 2, 2010

Thursday, February 18, 2010

Tuesday, February 16, 2010
2.16

2Trade= 2 winner = JPY 344361yen 74.6pips
USDJPY Long 2.11 5 DaysEURUSD Short 2.15 1 Day
because I thought EUR is over short position, and USD is over long position, so I take profit my swing trading positions today.
because I thought EUR is over short position, and USD is over long position, so I take profit my swing trading positions today.

Wednesday, February 10, 2010

Friday, February 5, 2010
2.4

1 trade = 1 winner = +136pips 682500
nowadays it has not been good performance for scalping trade, then I change to swing trade from this month, I had short position for EUR JPY at 126.365 on Feb 2nd, because I considered resistance would be at 127.00 level, and then I made Stp at 127.50 and Lmt at 125.00. and it was right.
Saturday, January 30, 2010
Trade of this Month of January
Jan.11.2010 ~ Jan.29.2010
42 Trades = 19 Winners 24 Losers= +54.3 pips = JPY +336154
JPY ¥3361541JPY = 1JPY
USD $ 3724USD = 90.26JPY
EUR € 2686 1EUR =125.12EUR
42 Trades = 19 Winners 24 Losers= +54.3 pips = JPY +336154
JPY ¥3361541JPY = 1JPY
USD $ 3724USD = 90.26JPY
EUR € 2686 1EUR =125.12EUR
Jan 27 to Jan. 29
Jan 27 to Jan. 29
14Trades= 7 Winners 8 Losers= -42.2 pip. = JPY - 153180
JPY ¥-153180 1JPY = 1JPY
USD $--1697 1USD = 90.26JPY
EUR €-1224 1EUR =125.12EUR
14Trades= 7 Winners 8 Losers= -42.2 pip. = JPY - 153180
JPY ¥-153180 1JPY = 1JPY
USD $--1697 1USD = 90.26JPY
EUR €-1224 1EUR =125.12EUR
Friday, January 29, 2010
1.29
3 trades= 1 win 2 loser= -314000 -62.8 pips
if EUR JPY drop to 124.80, result was opposite, but reality is EURJPY dropped to 124.813, I just needed 1.3pips,,, but loss is loss, that's trade. it was right trend goes to 50pips to 75pips, today it just stopped at 73.7pips. but loss is loss.

if EUR JPY drop to 124.80, result was opposite, but reality is EURJPY dropped to 124.813, I just needed 1.3pips,,, but loss is loss, that's trade. it was right trend goes to 50pips to 75pips, today it just stopped at 73.7pips. but loss is loss.

Thursday, January 28, 2010
1.28
3 trades = 3 wins - 1 loses = +236000yen +47.2 pips
today I change trading method from scalping to day trade:
USD/JPY starts at 90.00 today, and and I ordered Long at 90.25 and Short at 89.75. because nowadays USD EUR follows trend after it achieves + or - 25 pips on its day, and today it achieves at 90.25, and I thougtht it would be 90.50, and I make TC at 90.50. and that's right trade, +25pips 125000yen.
EUR/JPY follows trend after it achieves + or - 50 pips, today it goes + 50 pips. for risk management to think about USDJPY position, I ordered both short and long positions at 126.20 to 22 level, and I make TC +75 pips LC -50pips for both position, and It was right trade, +353500 (+70.7pips) for long position and -249000(-49.8pips)

today I change trading method from scalping to day trade:
USD/JPY starts at 90.00 today, and and I ordered Long at 90.25 and Short at 89.75. because nowadays USD EUR follows trend after it achieves + or - 25 pips on its day, and today it achieves at 90.25, and I thougtht it would be 90.50, and I make TC at 90.50. and that's right trade, +25pips 125000yen.
EUR/JPY follows trend after it achieves + or - 50 pips, today it goes + 50 pips. for risk management to think about USDJPY position, I ordered both short and long positions at 126.20 to 22 level, and I make TC +75 pips LC -50pips for both position, and It was right trade, +353500 (+70.7pips) for long position and -249000(-49.8pips)

Black Monday vs. Bankruptcy of Lehman Brothers
http://en.wikipedia.org/wiki/Black_Monday_(1987)
http://en.wikipedia.org/wiki/Bankruptcy_of_Lehman_Brothers
History repeats itself. do not you think?
Black Monday 10.19.1987
Market expected "Japan" to raise the rate of interest,
and 19 months later, May 1989, first raise the rate of interest
Bankruptcy of Lehman Brothers 9.17.2008
now Market expects "China" to raise the rate of interest.
and if it will be 19 months later China would raise the rate of interest, it would be April 2010!?
http://en.wikipedia.org/wiki/Bankruptcy_of_Lehman_Brothers
History repeats itself. do not you think?
Black Monday 10.19.1987
Market expected "Japan" to raise the rate of interest,
and 19 months later, May 1989, first raise the rate of interest
Bankruptcy of Lehman Brothers 9.17.2008
now Market expects "China" to raise the rate of interest.
and if it will be 19 months later China would raise the rate of interest, it would be April 2010!?
Wednesday, January 27, 2010

Monday, January 25, 2010
trade of the week, Jan,19th to 22th
Jan 19 to Jan. 22
11Trades= 4 Winners 7 Losers= 43.9 pips = JPY+223750
JPY ¥+223750 1JPY = 1JPY
USD $+2491 1USD = 89.82JPY
EUR €+1762 1EUR =127.00EUR
Friday, January 22, 2010
1.22

4Trades = 2winners + 2losers = +46.2pips +231000
GBP JPY L +37.1pips +185500
USD JPY L +23.1pips +115500
AUD JPY L -6pips -30000
EUR JPY L -8pips -40000
it is not sure that cross JPY is range or down trend yet, so I had Long position for range option today, let's see next week.
Thursday, January 21, 2010
1.21

AUD/JPY +160500 32.1pips
EUR/JPY -43500 -8.7pips
AUD/JPY 83.57 short entry 83.25 TC 83.75 LC →83.70→83.25 +32pips
EUR/JPY 129.03 Short entry 128.50 TC 129.30 LC →129.26→129.00→128.70→129.00→129.15 LC -8.7pips
Wednesday, January 20, 2010
28 currency pair Relative Strength tradeing method
this is better to see web site below than I write. :)
http://www.forexfactory.com/showthread.php?t=132537

Tuesday, January 19, 2010
1.19
2 Trades = 2 losers = -18.5pips -88250 JPY
AUD/JPY S -9.5 pips
EUR/USD L -9pips
I make TC for EUR/USD at 1.4415, and max was 1.4413.
it is just a few pips again,.but that's trade to lose. No excuse.
Well done for risk management. that's only good thing today. :)

AUD/JPY S -9.5 pips
EUR/USD L -9pips
I make TC for EUR/USD at 1.4415, and max was 1.4413.
it is just a few pips again,.but that's trade to lose. No excuse.
Well done for risk management. that's only good thing today. :)

Monday, January 18, 2010
2010 schedule
2010 schedule: Trade is 4 days a week(Tue.to Fri), Off Day is 3 days a week(Sat to Mon)
Off days in 2010=196days: 3 Day times 52 weeks(365days/7days)=156 Off Days + 2 weeks holidays every 2 month (8days times 5 times holidays = 40 days) = 196 off days in 2010!
Trading days in 2010=170 days : 366-196days = 170days trade.
*it would be changed if it is better to trade on Monday.
Good luck on 2010
Off days in 2010=196days: 3 Day times 52 weeks(365days/7days)=156 Off Days + 2 weeks holidays every 2 month (8days times 5 times holidays = 40 days) = 196 off days in 2010!
Trading days in 2010=170 days : 366-196days = 170days trade.
*it would be changed if it is better to trade on Monday.
Good luck on 2010
Saturday, January 16, 2010
trade of this week Jan.11 to Jan.15
Jan 11 to Jan. 15
Jan. 15 3 Trades = 2wins +1 lose = 26.9 pips = JPY + 134500
Jan. 14 4 trades = 1 winners +3 losers = JPY -49116 -10.4pips
Jan. 13 4 Trades = 3 wins - 1 lose = JPY +152000 + 30.4 pips
Jan. 12 2 Trades = 2 Losers = JPY - 80000 -16pips
Jan. 11 4 Trades = 2 winners + 2 losers = JPY ¥ +108,200 21.7pips
17Trades= 8 Winners 9 Losers= 52.6 pips = JPY+265584
JPY ¥+265,584 1 JPY = 1JPY
USD $+2926 1 USD = 90.76:JPY
EUR €+2034 1 EUR =130.57:EUR
Jan. 15 3 Trades = 2wins +1 lose = 26.9 pips = JPY + 134500
Jan. 14 4 trades = 1 winners +3 losers = JPY -49116 -10.4pips
Jan. 13 4 Trades = 3 wins - 1 lose = JPY +152000 + 30.4 pips
Jan. 12 2 Trades = 2 Losers = JPY - 80000 -16pips
Jan. 11 4 Trades = 2 winners + 2 losers = JPY ¥ +108,200 21.7pips
Friday, January 15, 2010
1.15

USD/JPY S -17500
USD/JPY L 29000
USD/JPY L 123000
today's 15th, so please check past post ; http://yuforex777.blogspot.com/2010/01/trading-method-by-short-supply-of.html
According to this method,
at 8:00 to 10:00 am(JPN time) we buy USD/JPY.
at 10:00 am (JPN time) we sell USD/JPY.
today i slept until noon... -_-zzz
so I did not trade, but this trading method could be used today's too.
at 8:00 to 10:00 am, it was difficult to have long entry, so in this case let's see how to make loss cut to have minimum loss like less than 10 pips, then let's see next short position trade after 10:00 am, it was at 91.18 level for USD/JPY, no matter we make stop at 10 pips to 20 pips, USD/JPY dropped to 90.649 without loss cut, right? so it means we could get 50pips as well, if I were in the morning market today at Japan time, I make loss -10pis at 8:00 to 10:00 am, I make profit +15pips of 50 pips, then I could have + 5 pips profit. It is more important to have minimum loss than max profit in my theory, huge profit has always a critical draw down, we should not forget about it. Today we will have index just before NY market opens, Let's see USD would be down as the USDJPY analyze for short to middle term. :)
Have a good trade!
Thursday, January 14, 2010
Simple strategy 1 EMA × RSI × Stochastic

Indicator: 5 EMA, 10 EMA, Stochastic (14, 3, 3), RSI (14)
Strategy:
Entry:
1.Cross of 5EMA and 10EMA,
2.RSI is more than 50,
3.stochastic is not overshot (80~20) and cross.
TC or LC
Cross of 5EMA and 10EMA on the opposite side.
Strategy:
Entry:
1.Cross of 5EMA and 10EMA,
2.RSI is more than 50,
3.stochastic is not overshot (80~20) and cross.
TC or LC
Cross of 5EMA and 10EMA on the opposite side.
1.14
AUD/JPY -35000 -7pips
EUR/JPY -32000 -6.4pips
EUR/JPY -32116 -7pips
EUR/JPY 50000 +10pips
4 trades = 1 winners + 4 losers = JPY -49116 -10.4pips
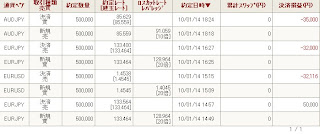
EUR/JPY -32000 -6.4pips
EUR/JPY -32116 -7pips
EUR/JPY 50000 +10pips
4 trades = 1 winners + 4 losers = JPY -49116 -10.4pips

let me excuse please, First trade was so beautiful, long at 133.46 and TC at 133.56. and EUR JPY up from 133.46 to 133.56, then it dropped from 133.56,. so trend went as I expected, it was one of the most beautiful trades ever, but I thought I would lose today because I always lose after beautiful trade! >_< And I was right, I called it!!!
Anyway, This is a good example why we should not trade with our emotion, we should trade without emotion, this is total sum game. Today it was beautiful trade, the more beautiful trade is, the more I feel glad to have the beautiful trade mentally, it causes loss possibly.
Wednesday, January 13, 2010
USD/JPY analyze
we saw bad number of index on last Friday, non farm employment change and unemployment rate.
as I said on Facebook on last Friday, It is better to trade after we can see trend from index. and now we could see USD/JPY would be down. (sorry If I am wrong on analyze, but * please trade on your own responsibility, i wont's take any responsibility.)
First please see this pic below.
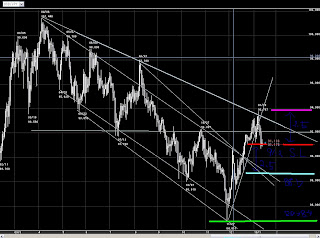
This is 300days daily candle chart.
now we could see down trend, and USD/JPY down to pass at 91.20..
91.20 is red support line on chart, and Hi-max is pink line at 93.70.
93.70 - 91.20 = 2.50
91.20 - 2.50 = 88.70
trend down to pass 91.20, and it down to 88.70 next on technical analyze.
if down trend will pass 88.70, next it would be 84.
Next, please see highest price at April 6 2009, Aug 7 2009, and Jan 8 2010, we can line for these three points as resistance line. Then we can consider USD/JPY was not convert yet and still continue down trend.
And According to Non Farm Employment Change and Unemployment Rate, we can see USD/JPY is down trend by fundamental analyze, Unemployment Rate has been 10% three months in raw,. and Non Farm Employment Change was minus again on Dec 2009.
I am not sure exactly how long down trend is continue, although I know people expect stronger USD, Market does not follow what people expect, I still see and consider that USD/PY is down trend.
.
as I said on Facebook on last Friday, It is better to trade after we can see trend from index. and now we could see USD/JPY would be down. (sorry If I am wrong on analyze, but * please trade on your own responsibility, i wont's take any responsibility.)
First please see this pic below.

now we could see down trend, and USD/JPY down to pass at 91.20..
91.20 is red support line on chart, and Hi-max is pink line at 93.70.
93.70 - 91.20 = 2.50
91.20 - 2.50 = 88.70
trend down to pass 91.20, and it down to 88.70 next on technical analyze.
if down trend will pass 88.70, next it would be 84.
Next, please see highest price at April 6 2009, Aug 7 2009, and Jan 8 2010, we can line for these three points as resistance line. Then we can consider USD/JPY was not convert yet and still continue down trend.
And According to Non Farm Employment Change and Unemployment Rate, we can see USD/JPY is down trend by fundamental analyze, Unemployment Rate has been 10% three months in raw,. and Non Farm Employment Change was minus again on Dec 2009.
I am not sure exactly how long down trend is continue, although I know people expect stronger USD, Market does not follow what people expect, I still see and consider that USD/PY is down trend.
.
VQ parameter

VQ parameter from Scalping to Swing Trade.
4,2,4,1
2,0,4,1
2,3,3,3
5,3,2,5
5,3,6,2
6,3,3,2
6,3,4,2
7,3,2,2
3,2,3,4
4,0,2,4
7,3,4,6
7,3,2,2
3,2,3,4
4,0,2,4
7,3,4,6
5,3,1,2
5,3,1,2
5,3,1,3
5,3,1,3
8,2,22,2
10,3,18,25
30,1,30,1
EUR USD Analyze
If we analyze USD in this year, all of us care about FRB monetary policy, especially interest rate,.
and its interest rate affect other countries' currency, today I want to post about EUR/USD.
first, let's see about interest rate of ECB and FRB.
if we back to the past, as we know, ECB follows FRB to make interest rate no matter it is up or down. ECB decided interest rate after FRB, shortest period is 4 months, longest one is 18 months, and average is 9 months.
In Sep.1998: FRB Interest Rate: Down
7months later,
In Apr.1999: ECB Interest Rate: Down
Jun. 1999 FRB UP
5 months later
Nov.1999 ECB UP
01.2001 FRB DOWN
4 months later
05.2001 ECB DOWN
06.2004 FRB UP
18 months later
12.2005 ECB UP
9.2007 FRB DOWN
13 months later
10.2008 ECB DOWN
therefore, if FRB will make interest rate up on Aug 2010,. probably ECB will make interest rate up in Dec 2010 at shortest term estimation or after 2011 at long term estimation.
As noted above, ECB followed FRB, and EUR/USD tend to be strong USD and Weak EUR just before FRB makes interest rate up as data.
For Example,.last time FRB had made interest rate UP was Jun 2004 and Jun 1999. both time started strong USD and weak EUR from a few month ago around 10%. then trend had changed strong EUR and weak USD until ECB had made intrest rate at both time in 1999 and 2004.
If this time 2010 is also according to past data, EUR/USD would be 10 % drop, then EUR/USD 1.5 could be at 1.35. and strong USD starts half years before FRB makes higher interest rate.
Finally, if FRB will make higher interest rate on Aug 2010. USD would be getting stronger since March, but EUR/USD already dropped from 1.5 since end of last year, so FRB would make higher interest rate on May or Jun 2010, or FRB would make higher interest rate in Aug, and EUR USD drops since Mar 2010, nowadays EUR/USD has been up, right? so it could be Aug. then we can analyze;
Jan to Mar EUR/USD UP to 1.5
Apr to Sep EUR/USD Down to 1.35
Oct to Dec EUR/USD UP to ?
and its interest rate affect other countries' currency, today I want to post about EUR/USD.
first, let's see about interest rate of ECB and FRB.
if we back to the past, as we know, ECB follows FRB to make interest rate no matter it is up or down. ECB decided interest rate after FRB, shortest period is 4 months, longest one is 18 months, and average is 9 months.
In Sep.1998: FRB Interest Rate: Down
7months later,
In Apr.1999: ECB Interest Rate: Down
Jun. 1999 FRB UP
5 months later
Nov.1999 ECB UP
01.2001 FRB DOWN
4 months later
05.2001 ECB DOWN
06.2004 FRB UP
18 months later
12.2005 ECB UP
9.2007 FRB DOWN
13 months later
10.2008 ECB DOWN
therefore, if FRB will make interest rate up on Aug 2010,. probably ECB will make interest rate up in Dec 2010 at shortest term estimation or after 2011 at long term estimation.
As noted above, ECB followed FRB, and EUR/USD tend to be strong USD and Weak EUR just before FRB makes interest rate up as data.
For Example,.last time FRB had made interest rate UP was Jun 2004 and Jun 1999. both time started strong USD and weak EUR from a few month ago around 10%. then trend had changed strong EUR and weak USD until ECB had made intrest rate at both time in 1999 and 2004.
If this time 2010 is also according to past data, EUR/USD would be 10 % drop, then EUR/USD 1.5 could be at 1.35. and strong USD starts half years before FRB makes higher interest rate.
Finally, if FRB will make higher interest rate on Aug 2010. USD would be getting stronger since March, but EUR/USD already dropped from 1.5 since end of last year, so FRB would make higher interest rate on May or Jun 2010, or FRB would make higher interest rate in Aug, and EUR USD drops since Mar 2010, nowadays EUR/USD has been up, right? so it could be Aug. then we can analyze;
Jan to Mar EUR/USD UP to 1.5
Apr to Sep EUR/USD Down to 1.35
Oct to Dec EUR/USD UP to ?
1.13

4 Trades = 3 wins - 1 lose = JPY +152000 + 30.4 pips
EUR/JPY -50000 -10pips
EUR/JPY +61000 +12.5pips
USD/JPY +41000 +8.3pips
AUD/JPY +100000 +20pips
It was good trades except first one, I had long entry for AUD JPY at 84.14 on MA200 level, but it droped to 83.9... but I did not cut my loss, today I have good profit, but it is just result, I might have big loss today because of first one... :(
Selling timing
We often see advertise about ETF nowadays since end of year, right? It means People always buy the higest price anytime during ads season, Gold is always interesting to see, compared with USD and people, it looks recovering economic in this year, but inside traders' mind we are always ready to sell. A number of TV adv...ertise is quite correct indicator to sell. :)
When we see a lot of the same kind of advertisement broadcast or books published, it might be timing to sell,
When we see or hear neighborhood's house wives and college students start to invest stock, it might be timing to sell.
this is ironic, but it is true, market is expand when it is limited.
When we see a lot of the same kind of advertisement broadcast or books published, it might be timing to sell,
When we see or hear neighborhood's house wives and college students start to invest stock, it might be timing to sell.
this is ironic, but it is true, market is expand when it is limited.
about JAL
JAL is 37 yen,,, it is also great opportunity to trade stock almost broke down, but I could not. I wanted to be pilot when I was kid, so JAL is kinda special and symbol of my childfood dream,,, although traders should not have emotion and feeling neither, I do not want to see that my childfood hero is fail on my adlutf...ood no matter I do understand every bankrupt has reason and kids are innocent to love company without reason... It is hard to see that...
http://www.bloomberg.com/apps/news?pid=2
http://www.bloomberg.com/apps/news?pid=2
Tuesday, January 12, 2010
T3MA Trading Method
MT4: T3MA.mq4
T3MA
EMA 50 20 200
Long Entry:
1. entry when EMA 50 20 are above 5M T3MA
2. when EMA 50 or 20 are rally on resistance line
Short Entry
1.Entry when EMA 50 20 are below 5M T3MA
2. Entry when EMA 50 or 20 are rally on support line.
* when EMA200 comes. let's see what's going on.
* T3MA moves so strange, lt is better to ignore, and restart MT4, then check out
mild line position.

Jan.12.2010
2 Trades = 2 Losers


AUD/JPY -45000 -9pips
AUD/JPY -35000 -7pips
JPY - 80000 -16pips
I feel I am loser if I do not excuse today's loss from now on, LOL
First Trade is not wrong entry, here it was 15:00, and Euro was getting start market,.
so I expected price would be up, and I was right AUD/JPY rose up,. I expect 15 pips at least, but it rose just 12 pips, and benefit was gone, and I have to get loss.
Second Trade is nothing to say.
No matter I lost today, I did well for risk management. That's more important to manage risk. :)
Good luck for your trade :)
Monday, January 11, 2010
First Trade on 2010
Today is the first day to trade. :)


4 Trades = 2 winners + 2 losers
AUD/JPY Long 17.9 pips JPY +89500
USD/JPY L 7.9 pips JPY -39800
USD/JPY L 7pips JPY -35000
USD/JPY L 18.7pips JPY +93500
Total JPY ¥ +108,200 21.7pips
Japan is holiday(Coming-of-Age Day) today. so I did not trade during Tokyo market time, I started after Tokyo close to London market open. As I expected, price rate has been up since Euro market opened. I thought open time is easiest to earn today, and I was right. Although I should stop trade today after I finished 3rd trade (-7.9pips), AUD/JPY looked like jumping up. I had Long position for AUD/JPY at 85.92. that's right trade, it rose up to 86.10 as I expected, then I got 17.9 pips. It is good start trading in 2010. Good luck for trading, you guys too. :)


How to see entry point for day trade
MT4:
ADXm.mq4
00-MTFizer_v102.mq4
Candle 30 mins Candle Chart for 00-MTFizer
TimeFrame -1 and -2
ADXm is for trend follow
we could see hint of entry point for Day Trade to use this method.
Friday, January 8, 2010
ADX and Parablic trend follow trading method

Parabolic SAR default settings (0.02, 0.2)
ADX 50 (with +DI, -DI lines)
Strategy:
ADX set parameter to 50
Entry "Parabolic trend follow" and "+DI and -DI cross".
Ignore "+DI and -DI cross" and "Parabolic rally"
TC "+DI and -DI opposite side Cross" or "ADX would achieve 25 line"
Wednesday, January 6, 2010
EUR/USD 30min Trading method with MACD + Parabolic

MACD (12, 26, 9)
Parabolic SAR default settings (0.02, 0.2)
Strategy:
Entry
1. MACD Cross
2 Parabolic trend follow
TC
1.MACD Cross
* I have posted several methods. I feel sorry I cannot show more detail, btw, some people asked me question on these days like this "those methods can be used currently or not?" answer is Yes and No, because those methods were used before, and I just post each one method of over 200 hundreds methods per day, it can be used right now but also cannot be used right now, we do not know what future trend will be like exactly. If you like some of methods and would like to use it, PLEASE DO BACK TEST FIRST, there is no trade we can use forever because market trend has changed each term. When i use new trading method on the market, first I do back test and demo, then if I get good result from back test and demo, I start to use new trading method on the market until it is expired. *** Please trade your own risk and responsibility, I won't take any responsibility for you trade and result of win and lose. Good luck for trade! :)
Tuesday, January 5, 2010
00-RVI_v100.mq4 00-SuccessTrade.mq4
MT4 :
00-RVI_v100.mq4
00-SuccessTrade.mq4
It is interesting MT4 system trading method, but we have to check it can be used for current trend on the market or not. If it is ready, then it would works :)

result on Jan. 4th with TTM in short supply trading method
please compared with yesterday blog about TTM trading method.
today's 5th Jan. Let's see how it is going.
8:00 a.m. Japan time:
start price on USD/JPY was 92.416
and let's see "strategy" on yesterday blog,
we order long position to aim 10 to 30 pips afer 8:00.
USD JPY was 92.416 at 8:00 am
and USD JPY rose up to 92.538 at 8:22 am
then we could have 10 pips
next. let's see USD JPY at 10:00 am
according to stratedy, we order short position to aim 10 to 30 pips after 10:00 am.
start price of USD JPY was 92.362 at 10:00 am
then, USD JPY has dropped to 91.62 at present,
we could get 10 pips, moreover 30 pips as well. :)
I do think 10 pips is enough, we could get 30 pips and 70 pips right now.
that's one of trading methods on 5th. 10th, 15th, 20th, 25th each month :)
today's 5th Jan. Let's see how it is going.
8:00 a.m. Japan time:
start price on USD/JPY was 92.416
and let's see "strategy" on yesterday blog,
we order long position to aim 10 to 30 pips afer 8:00.
USD JPY was 92.416 at 8:00 am
and USD JPY rose up to 92.538 at 8:22 am
then we could have 10 pips
next. let's see USD JPY at 10:00 am
according to stratedy, we order short position to aim 10 to 30 pips after 10:00 am.
start price of USD JPY was 92.362 at 10:00 am
then, USD JPY has dropped to 91.62 at present,
we could get 10 pips, moreover 30 pips as well. :)
I do think 10 pips is enough, we could get 30 pips and 70 pips right now.
that's one of trading methods on 5th. 10th, 15th, 20th, 25th each month :)
Monday, January 4, 2010
Trading Method by Short Supply of Telegraphic Transfer Middle rate
TTM = Telegraphic Transfer Middle rate
ex. http://www.hsbc.co.jp/1/2/hsbc-premier/disclaimer/fx_disclaimer
TTM in short supply = Long cross JPY
this is kinda fundamental trading method to entry long position for USD when it is in the morning before around 10'clock (Japan time) on 5th 10th 15th 20th 25th each month, because TTM are in short supply.
Strategy:
in the morning on 5th 10th 15th 20th and 25th each month
8 a.m. - 10 a.m. (Japan time) Long USD to aim 10 pips to 30 pips
after 10a.m.Short USD to aim 10 pips to 30 pips
if TTM is in short supply on 20th 30th = Watch out for Long USD
Watch out if it is down trend
Check news all time to know how many number of TTM in the market.
tomorrow will be 5th Jan. Good luck for trade :)
ex. http://www.hsbc.co.jp/1/2/hsbc-premier/disclaimer/fx_disclaimer
TTM in short supply = Long cross JPY
this is kinda fundamental trading method to entry long position for USD when it is in the morning before around 10'clock (Japan time) on 5th 10th 15th 20th 25th each month, because TTM are in short supply.
Strategy:
in the morning on 5th 10th 15th 20th and 25th each month
8 a.m. - 10 a.m. (Japan time) Long USD to aim 10 pips to 30 pips
after 10a.m.Short USD to aim 10 pips to 30 pips
if TTM is in short supply on 20th 30th = Watch out for Long USD
Watch out if it is down trend
Check news all time to know how many number of TTM in the market.
tomorrow will be 5th Jan. Good luck for trade :)
Sunday, January 3, 2010
Swing Trade with Carry, Momentum, and Value trade method.
Swing Trade using those;
1. Carry Trade = Buy the highest interest currency and Sell the lowest currency2. Momentum Trade = Buy the highest return currency and Sell the lowest return currency.
3. Value trade = According to "PPP", Buy the lowest currency, and sell the highest one.
Leverage: less than 10
Trade: middle to long term trading method
Currency: USD/JPY, AUD/JPY, EUR/JPY, GBP/JPY, and CAD/JPY
This is for Swing Trade, so please do back test, and please find the best TC and LC, but if it is wrong, please do not trade, it is not time to trade in this case.
Please do risk management with low leverage.
Good luck for trade :)
This is for Swing Trade, so please do back test, and please find the best TC and LC, but if it is wrong, please do not trade, it is not time to trade in this case.
Please do risk management with low leverage.
Good luck for trade :)
Saturday, January 2, 2010
Support and Resistance.mq4 trading method.

MT4 indicator for breakout or TC,.
It can be good to use with MACD and stochastic.
Good luck for your trade. :)
I will be back to Market and trade from Jan 18th in 2010. :)
This year is important to see next 3to 5 years. We can do the best. :)
Friday, January 1, 2010
scalping for USD/JPY method
USDJPY scalping method
MT4: mt4bbtpl.lzh
Trading: Scalping
Currency: USD/JPY
Chart: 1min and 5mins Candle

MT4: mt4bbtpl.lzh
Trading: Scalping
Currency: USD/JPY
Chart: 1min and 5mins Candle

Wednesday, December 30, 2009
THV.lzh trade method
THV.lzh
MT4 based on Ichimoku
Short bar is for scalping Long bar is for swing trade.

MT4 based on Ichimoku
Short bar is for scalping Long bar is for swing trade.

Tuesday, December 29, 2009
MACD + Support or Resistance Breakout
MACD 11、12、11
Stop: Support or Resistance Line before MACD 0 Line Cross.
Entry Point:
MACD 0 line cross
Support or Resistance break out
Stop: Support or Resistance Line before MACD 0 Line Cross.
it is better to use this method with other indicator like Fibonacci target.
Monday, December 28, 2009
5MA+CCI zero cross Method

5 Min Candle
Entry open prince of the newest 5 min candle when trend passes 5 MA. and next bar's close price still keeps 5MA passing side and passing zero,
TC when each 5 min bar's end price cannot keep 5MA side.
*check Candle Chart; Day, 4hr, 1hr, put trend line for each candle, see trend and follow market.
also put MA 21, 50, 98, 150, 200
Rule
Don't forget loss cut, there are many chances.
TC before Range
Don't trade on the non fluctuation price market
Sunday, December 27, 2009
Heikin 60min × 1 min slow stochastic

Entry only when 60 min and 1 min are the same trend,
Entry when 60 min is up bar, slow-stoch is up bar from down, and 1 min change down bar to up bar,
Make stop at about 5pips from latest down bar.
Make limit when 1 min bar will be rally or upper or lower shadow is shorter than last shadow.
cut loss correctly
it is less benefit, but also it is less loss 0 -20 pips Pips
if you cannot win 90% of trades from this method, it meant this method is not fit to market right now, it is better to use this method when it works, it works when it is over 90 %.
Good luck on trade. :)
Tuesday, December 15, 2009
Heikin trading method 1

Heikin (DAY, 1hr, 30min, 15min, 5min.)
BB 22 for overshoot
MACD 4, 26 9 for entry point
STC 5,22,5 for entry point
Slow Stochastic 42,3,4 for entry point
ADX 6 for trend
How to entry;
VT Trader
1. check long term trend by Day Heikin
2. Middle term trend by 1hr Heikin
3. Short term trend by 30m 15m Heikin
4. Check Entry Point by 5 mins
Up trend: Heikin up bar in raw
Down trend: Heikin down bar in raw
The reason why to use Heikin, not candle bar is easier to check Trend by Heikin than Candle Bar.
5. wait for entry until 5 min Heikin is the same trend to Middle and Long term.
For Swing or Day Trade: 30min Heikin and 1hr Heikin
For Day Trade: 30mins Heikin and 15mins Heikin
For Scalping 15mins Heikin and 5mins Heikin
6. prepare to entry in case when 5mins and Middle and Long Tern are the same trend.
7. Entry when :
MACD is GC or DC
Slow Stochastic is GC or DC
STC converses to the Trend
ADX is up right or down right
Don't forget to make STOP,
and for TC it is better to use ADX,
*please trade on your risk and responsibility, I won't take any responsibility for your trade.
Good luck for trade.
Sunday, December 13, 2009
Trade of the week 12/7 ~ 12/11
Good and Stable trading performance in this week. :)
Risk management makes good and stable trading, please do not forget about it.
Here's this week's trading result;
7wins 7 loses
+104.3pips - 52.8 pips = + 51.5 pips
Capital Gain in this week:
JPY ¥433,130 1 JPY = 1 JPY
USD $4,862.25 1 USD = 89.080000 JPY
EUR €3,327.35 1 EUR = 130.172604 JPY
FRI
2Win 1 Lose
+¥284000 -¥70000 = +¥214000
+28.4 pips -7pips = 21.4pips
THU
0W-2L
-¥140000
0pips-14pips= -14pips
WED
3W-2L
+¥99130
+35.9pips - 14.8pips = +21.1pips
TUE
1W-1L
+¥130000
+20pips-7pips= +13pips
MON
Risk management makes good and stable trading, please do not forget about it.
Here's this week's trading result;
7wins 7 loses
+104.3pips - 52.8 pips = + 51.5 pips
Capital Gain in this week:
JPY ¥433,130 1 JPY = 1 JPY
USD $4,862.25 1 USD = 89.080000 JPY
EUR €3,327.35 1 EUR = 130.172604 JPY
FRI
2Win 1 Lose
+¥284000 -¥70000 = +¥214000
+28.4 pips -7pips = 21.4pips
THU
0W-2L
-¥140000
0pips-14pips= -14pips
WED
3W-2L
+¥99130
+35.9pips - 14.8pips = +21.1pips
TUE
1W-1L
+¥130000
+20pips-7pips= +13pips
MON
1W-1L
+¥130000
+20pips-7pips= +13pips
Saturday, December 12, 2009
12/11
EUR JPY 15.7pips
EUR JPY 12.7 pips
EUR JPY -7pips
3 trades = 2 wins 1 lose = 21.4pips
Although I loss cut last one, it was right to read trend, but I finish trading in this week.
that's how I do for risk management, I feel nothing to win and lose trade, it is total sum game, keep your trading method and risk management, and if you win trade, that's right way for trading,
I said that I would take winter vacation from tomorrow for a month,
but probably I will trade if I think it is chance to do, but I will be more carefully, so I won't trade everyday probably. that's how I spend this winter vacation.
Instead of posting trade dairy next week, I would like to post trading methods next week. :)
some of them might be helpful for you. :)
*Please trade from your own risk, i won't take any responsibilities.

EUR JPY 12.7 pips
EUR JPY -7pips
3 trades = 2 wins 1 lose = 21.4pips
Although I loss cut last one, it was right to read trend, but I finish trading in this week.
that's how I do for risk management, I feel nothing to win and lose trade, it is total sum game, keep your trading method and risk management, and if you win trade, that's right way for trading,
I said that I would take winter vacation from tomorrow for a month,
but probably I will trade if I think it is chance to do, but I will be more carefully, so I won't trade everyday probably. that's how I spend this winter vacation.
Instead of posting trade dairy next week, I would like to post trading methods next week. :)
some of them might be helpful for you. :)
*Please trade from your own risk, i won't take any responsibilities.

Thursday, December 10, 2009
12/10
AUD JPY -7pips
EUR JPY -7pips
2trades 0 Win 2 Loses -14pips
I lost way,,, if I continue trading. I might lose 100 times in raw. I better stop here,

EUR JPY -7pips
2trades 0 Win 2 Loses -14pips
I lost way,,, if I continue trading. I might lose 100 times in raw. I better stop here,

Wednesday, December 9, 2009
12/9
EUR JPY 11.3 pips
EUR JPY 15.5 pipsEUR JPY 9.1 pips
EUR JPY -6.1pips
EUR JPY -8.7 pips
5 trades = 3 win 2 lose = 21.1pips
today I trade around 128.80~ 129.10 to aim "buy on dip",
nowadays, for most of currency's case, when price drops at .00 like 129.00 today,
it dropped to .80~.89, so if I make sure that trend drops at .80 ~, and it rises at 90, it is possible "buy on dip" position up to 30 pips. so I have buy order at 128.90~99, and I have sell order at 129.10.
and if it drops after that, it is possible to be "30pips range", so next I have sell order each 10 pips, but you can aim 30pips, not 10 pips, I just aim 10 pips in this case.
possibility is possibility, so it might be 10% or 90%, I think this one is high possibility one. :)
However, do not forget "risk management" as i said, say, am gonna say 100 times, today I made loss cut twice in raw, so I stop trade for risk management, and that's fine trade today, BUT actually I really think I should stopped trade at first loss cut today! >_< because this is better way for me to manage risk. It is more important to save - pips everyday for my trade. :)

Tuesday, December 8, 2009
12/8
EUR JPY 2 trades 1 Win 1 Lose +13pips
when trend breaks EUR, it goes 30 pips more ususally,
I make limit 20 pips, but you can aim near +30 pips.
but do not forget risk management is more important,
In my opinion, we do not need 100 pips per day.
10 pips is enough if I could avoid critical draw down to aim over 100 pips. :)

when trend breaks EUR, it goes 30 pips more ususally,
I make limit 20 pips, but you can aim near +30 pips.
but do not forget risk management is more important,
In my opinion, we do not need 100 pips per day.
10 pips is enough if I could avoid critical draw down to aim over 100 pips. :)


Sunday, December 6, 2009
USD?JPY?
I just wondered whether Japan is gonna sell US Bond or not,
first of all, they could sell US Bond with such a pressure.
US dollar worth will be less than now, and it is natural to prepare for selling bond,
leader and government were changed, they could do stuffs former government did not.
.
selling bond → interest rate up → strong USD, and export stock slump → more depression
Investors lost interests in Japan, JPY will be weaker itself, it does not matter for strong USD or not. It is time that it is difficult for Japan to spend bond themselves. they have to sell their own capital now, if they cannot, they cannot earn from bond with low interest rate, if it happens, payment of interest will be more 25% of tax income. They cannot expect more tax, but they would have more payment, in this case, Japanese bond would be close out.
but, in fact, if other countries like china just export all stuffs to US, nothing is gonna be sold in US market, so if other countries never buy bond, all counties exporting to US are gonna be bankrupt. and we know why china buy US bond.
I think Japan cannot sell bond, they have to be patient with pressure, if they sell, they are gonna sell after China might sell first. Although we never know when China bubble gonna burst or not in the future.
first of all, they could sell US Bond with such a pressure.
US dollar worth will be less than now, and it is natural to prepare for selling bond,
leader and government were changed, they could do stuffs former government did not.
.
selling bond → interest rate up → strong USD, and export stock slump → more depression
Investors lost interests in Japan, JPY will be weaker itself, it does not matter for strong USD or not. It is time that it is difficult for Japan to spend bond themselves. they have to sell their own capital now, if they cannot, they cannot earn from bond with low interest rate, if it happens, payment of interest will be more 25% of tax income. They cannot expect more tax, but they would have more payment, in this case, Japanese bond would be close out.
but, in fact, if other countries like china just export all stuffs to US, nothing is gonna be sold in US market, so if other countries never buy bond, all counties exporting to US are gonna be bankrupt. and we know why china buy US bond.
I think Japan cannot sell bond, they have to be patient with pressure, if they sell, they are gonna sell after China might sell first. Although we never know when China bubble gonna burst or not in the future.
Saturday, December 5, 2009
Trade in this week, 11/30 to 12/4:
Trade in this week, 11/30 to 12/4:
profit: 131.2 pips
11 Wins
10 Loses
+187.2pips
-56pips
This week profit:
JPY ¥1,023,593 JPY=1Yen
USD $11,322 USD=90.49Yen
EUR €7,619 EUR=134.332Yen
12/4 +37.2pips 2 Win 0 Lose +37.2 pips - 0 pips
12/3 +23pips 2w 1l +30 -7
12/2 +13pips 1w 1l +20 -7
12/1 +30pips 4wins 7loses +65 -35
11/30 +28pips 2w 1l 35pips -7pips
I was lucky that market have been rally so simply that I could take profit. :)
However, you know it does not matter for me how much pips I have got during week.
It does matter for me how much I cut my loss,
I could cut my loss less than 10 pips for all trade.
100 pips per week is so enough, 50 pips is just enough for me.
It means you do not have to get 100 pips per day,
if you could get 10 pips per day, you could be millionaire. :)
Next week would be my final week for trading in this year,
I will take winter vacation from 12th to next year for one month.
For us, Day Traders, Private Investors, it is better not to trade for Christmas Season if you do not have budget like HF. :(
Let's take vacation! we, Day Traders, do have FREE TIME we can spend anytime in our life!
Good luck for your trade. And have a nice weekend.:)
Free time ::: http://en.wiktionary.org/wiki/free_time
Friday, December 4, 2009
trade 12.4
EUR JPY +22.2pips
GBP USD +15pips
today pips = +37.2 pips
how to trade during Index: like unemployment rate and non farm employment change
1. set order without limit
2. set stop (less than -10pips is better)
3. see the 1mins candle chart with BB
4. set trail 10 pips to 15 pips
4. entry if price cross BB +-2α and +-3α,
5. .take profit when its candle changed or follow your trail .
6. if you want more profit, entry when above candle change again and follow your trail.
7. do not forget set stop, risk management is the most important for this case too.
it is like playing game, it is better to trade like game for index. :)

GBP USD +15pips
today pips = +37.2 pips
how to trade during Index: like unemployment rate and non farm employment change
1. set order without limit
2. set stop (less than -10pips is better)
3. see the 1mins candle chart with BB
4. set trail 10 pips to 15 pips
4. entry if price cross BB +-2α and +-3α,
5. .take profit when its candle changed or follow your trail .
6. if you want more profit, entry when above candle change again and follow your trail.
7. do not forget set stop, risk management is the most important for this case too.
it is like playing game, it is better to trade like game for index. :)

Thursday, December 3, 2009

Wednesday, December 2, 2009
trade 12/2
USD JPY Long -7
Total 1W-1L 13pips
I get tired to write blog,,, I thought I would quit within 3days, but i still keep writing, :)
I want to trade more today, but I better stop now, because today I thought it is better to have short position,,, but now it has been up,,, In my experience, I better stop here, don't forget 10 pips enough for one day, huge pips has huge draw down usually, most important thing for trading. is risk management, i could say that 100 times. Risk management is the result in my trading record.
I just check rate and trend rest of today's market. good luck for trade. :)

today's strategy
USD JPY
Short 87.20-40
Limit 86.30-60
Stop 87.60-80
EUR JPY
Short 131.20-40
Limit 130.00-20
Stop 131.80-132.00
Short 87.20-40
Limit 86.30-60
Stop 87.60-80
EUR JPY
Short 131.20-40
Limit 130.00-20
Stop 131.80-132.00
Tuesday, December 1, 2009
today's trade
I did not know what happened just after I cut my loss at 15:38. It dropped 100 pips.
if Bank of Japan intervention would be 10,000,000,000,000 yen,
it used to be 200,000,000,000,000 Yen before.
and Shirakawa's announce will be 17:00, 1hrs late, AUD index is also less than expected, maybe he is thinking again.
I done today's trade after I loss cut, let's see 17'o'clock at Tokyo time..
My trade is Day Trade or Scalping Trade after thanks giving, it is more difficult to forecast rate during market in the end of the year
today's trade:
EUR JPY -8.6pips
EUR JPY 20pips
CHF JPY 15pips
EUR JPY 15 pips
NZD JPY -7pips
USD JPY -7pips
CAD JPY 15pips
GBP JPY -7pips
EUR JPY -2.2 pips
EUR JPY -1.4 pips
EUR JPY -1.8 pips
11 trades ( 4 wins 7 loses)
65pips - 35 pips = + 30 pips

.
if Bank of Japan intervention would be 10,000,000,000,000 yen,
it used to be 200,000,000,000,000 Yen before.
and Shirakawa's announce will be 17:00, 1hrs late, AUD index is also less than expected, maybe he is thinking again.
I done today's trade after I loss cut, let's see 17'o'clock at Tokyo time..
My trade is Day Trade or Scalping Trade after thanks giving, it is more difficult to forecast rate during market in the end of the year
today's trade:
EUR JPY -8.6pips
EUR JPY 20pips
CHF JPY 15pips
EUR JPY 15 pips
NZD JPY -7pips
USD JPY -7pips
CAD JPY 15pips
GBP JPY -7pips
EUR JPY -2.2 pips
EUR JPY -1.4 pips
EUR JPY -1.8 pips
11 trades ( 4 wins 7 loses)
65pips - 35 pips = + 30 pips

.
Strong Yen
it is better to say Weakness of USD, Yen is strong now,
but in Japan people have negative image for strong Yen.
So public opinion do not prefer Strong Yen.
but,,, let's image if we are government, Japan does not have resources in their country, so they need to import, now is strong yen, it is great chance to buy resources from abroad. why don't they get resources now, I think they already start to buy resources, nowadays what they want in these years,, they do want Rear Metal. It is chance to buy resources they really wanted.
As we know, Japan is country to have bad image for strong yen, but we know people have no sense of economic, that's why most of people try to be employees in Japan no matter it is kinda worst working environment in advance countries of the world So they do not even have particular reason to hate strong yen, just they have experienced strong yen time every time when economic is depression. Most of people believe Japan has bauble in 80's because employees work so hard to sacrifice life time, but sorry that's not reason. Anyway whatever reason,people hate strong yen.
So government comments negative stuffs and never admire strong yen for public opinion, people believe export industry like car industry damages and affect normal people's life, but all 120 million population people belong to Car company? and Toyota, Honda, Nissan, etc, have experience strong yen, it was USD/JPY=300 in 70's. it was USD/JPY = 180 during good year end of 80's to early 90's. and now it is USD/JPY = 80. Major company never learn about foreign exchange for 30 years? they do learn and prepare. Anyway negative comment and news about strong yen are so extreme, As the result, JPY/USD is back from 100 to 85 in half year.
Although I think weakness of USD is main reason, we don't need to take government comment and news, we should see YEN tectonically on chat or See Yen compared with USD. During fake rise from comment and news, it is time to buy rear metal, there is no material that Nikkei is up, only Nikkei is up because of NY Dow, China recovers from depression first in the world, if you like to buy Japan, let's see Chinese market first.
but in Japan people have negative image for strong Yen.
So public opinion do not prefer Strong Yen.
but,,, let's image if we are government, Japan does not have resources in their country, so they need to import, now is strong yen, it is great chance to buy resources from abroad. why don't they get resources now, I think they already start to buy resources, nowadays what they want in these years,, they do want Rear Metal. It is chance to buy resources they really wanted.
As we know, Japan is country to have bad image for strong yen, but we know people have no sense of economic, that's why most of people try to be employees in Japan no matter it is kinda worst working environment in advance countries of the world So they do not even have particular reason to hate strong yen, just they have experienced strong yen time every time when economic is depression. Most of people believe Japan has bauble in 80's because employees work so hard to sacrifice life time, but sorry that's not reason. Anyway whatever reason,people hate strong yen.
So government comments negative stuffs and never admire strong yen for public opinion, people believe export industry like car industry damages and affect normal people's life, but all 120 million population people belong to Car company? and Toyota, Honda, Nissan, etc, have experience strong yen, it was USD/JPY=300 in 70's. it was USD/JPY = 180 during good year end of 80's to early 90's. and now it is USD/JPY = 80. Major company never learn about foreign exchange for 30 years? they do learn and prepare. Anyway negative comment and news about strong yen are so extreme, As the result, JPY/USD is back from 100 to 85 in half year.
Although I think weakness of USD is main reason, we don't need to take government comment and news, we should see YEN tectonically on chat or See Yen compared with USD. During fake rise from comment and news, it is time to buy rear metal, there is no material that Nikkei is up, only Nikkei is up because of NY Dow, China recovers from depression first in the world, if you like to buy Japan, let's see Chinese market first.
Monday, November 30, 2009
trade on 30th at tokyo time
EUR USD -7pips
EUR USD +15pips
EUR USD +20pips
3 trades (2win 1lose) = + 28 pips
that's enough to get at least 10 pips a day,
So I already done for trading today at Tokyo Market time.
I will just see London and NY today.
see you tomorrow,
have a good trading :)
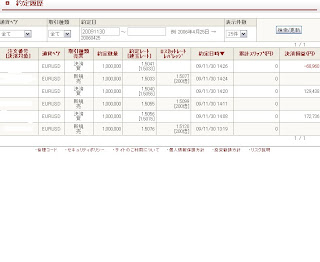
EUR USD +15pips
EUR USD +20pips
3 trades (2win 1lose) = + 28 pips
that's enough to get at least 10 pips a day,
So I already done for trading today at Tokyo Market time.
I will just see London and NY today.
see you tomorrow,
have a good trading :)

today&s strategy
USD JPY Short 87.20-40
Limit 86.00-15
Stop 88.00-15
EUR JPY Short 131.10-25
Limit 129.05-10
Stop 132.00-15
GBP JPY short 143.90-10
Limit 141.50-70
Stop 145.00-20
Limit 86.00-15
Stop 88.00-15
EUR JPY Short 131.10-25
Limit 129.05-10
Stop 132.00-15
GBP JPY short 143.90-10
Limit 141.50-70
Stop 145.00-20
Sunday, November 29, 2009
Forecast Range and market of new week
USD JPY 85.33 ~ 88.60
Euro JPY 126 ~ 135
we have to focus these points in this week:
US market
Index, US Index mainly
Dubai Shock
Gold price
US Long-term interest rate
The end of the Year Market and Sells
Factor of the end of Nov and the beginning of Dec
FRB
ECB
RBA
Oil price
Beige Book
Euro JPY 126 ~ 135
we have to focus these points in this week:
US market
Index, US Index mainly
Dubai Shock
Gold price
US Long-term interest rate
The end of the Year Market and Sells
Factor of the end of Nov and the beginning of Dec
FRB
ECB
RBA
Oil price
Beige Book
Date
Country
Time(Tokyo)
Index
Forecast
Previous
Max PIPS
Ave.PIPS
11/30 (M)
(NZD)
06:45
Building Consents m/m
N/A
3.3%
27
18.7
(JPY)
08:50
Prelim Industrial Production m/m
2.5%
2.1%
114
35.3
(CAD)
22:30
GDP m/m
N/A
-0.1%
88
40
(USD)
23:45
Chicago PM I
53.0
54.2
45
29
12/1 (T)
(AUD)
09:30
Building Approvals m/m
2.0%
2.7%
26
16.9
12:30
RBA Rate Statement
3.75%
3.50%
160
46.5
(USD)
24:00
ISM Manufacturing PMI
54.8
55.7
91
34.9
12/2 (W)
(USD)
22:15
ADP Non-Farm Employment Change
-155K
-203K
141
32.6
28:00
Beige Book
24
24
12/3 (Th)
(AUD)
10:30
Retail Sales m/m
0.3%
-0.2%
52
27.4
(EUR)
21:45
Minimum Bid Rate
1.00%
1.00%
118
61.5
22:30
ECB Press Conference
(USD)
22:30
Fed Chairman Bernanke Testifies
8.5%
9.5%
28
19
24:00
ISM Non-Manufacturing PMI
51.5
50.6
65
31.2
12/4 (F)
(CAD)
21:00
Employment Change
N/A
-43.2K
122
55.4
(USD)
22:30
Non-Farm Employment Change
-118K
-190K
121
61.6
(CAD)
24:00
Ivey PMI
N/A
61.2
85
37
Subscribe to:
Posts (Atom)