Feb 2006. News was about Iceland. USDJPY 2/20 118.25 → 3/1 115.60: -2.2%
Feb 2007. Shanghai. USDJPY 2/20 120.04 → 3/5 115.60: -4.1%
Feb 2008. Bear Stearns USDJPY 2/20 108.14 → 3/20 95.77: -11.4%
Feb 2009. Friancial Crisis USDJPY 2/20 93.4 → 3/17 99.69: +6.7%
Feb 2010: Greece USDJPY 2/20 91.5 → 3/4 88.14: -3.7%
And this Feb main new was about Middle East,,, every Feb market gives bad news, and important thing is to see what was happened in March?
.
Showing posts with label Analyze. Show all posts
Showing posts with label Analyze. Show all posts
Tuesday, March 1, 2011
Thursday, January 28, 2010
Black Monday vs. Bankruptcy of Lehman Brothers
http://en.wikipedia.org/wiki/Black_Monday_(1987)
http://en.wikipedia.org/wiki/Bankruptcy_of_Lehman_Brothers
History repeats itself. do not you think?
Black Monday 10.19.1987
Market expected "Japan" to raise the rate of interest,
and 19 months later, May 1989, first raise the rate of interest
Bankruptcy of Lehman Brothers 9.17.2008
now Market expects "China" to raise the rate of interest.
and if it will be 19 months later China would raise the rate of interest, it would be April 2010!?
http://en.wikipedia.org/wiki/Bankruptcy_of_Lehman_Brothers
History repeats itself. do not you think?
Black Monday 10.19.1987
Market expected "Japan" to raise the rate of interest,
and 19 months later, May 1989, first raise the rate of interest
Bankruptcy of Lehman Brothers 9.17.2008
now Market expects "China" to raise the rate of interest.
and if it will be 19 months later China would raise the rate of interest, it would be April 2010!?

Wednesday, January 13, 2010
USD/JPY analyze
we saw bad number of index on last Friday, non farm employment change and unemployment rate.
as I said on Facebook on last Friday, It is better to trade after we can see trend from index. and now we could see USD/JPY would be down. (sorry If I am wrong on analyze, but * please trade on your own responsibility, i wont's take any responsibility.)
First please see this pic below.
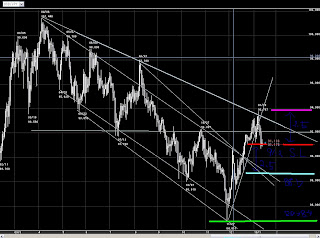
This is 300days daily candle chart.
now we could see down trend, and USD/JPY down to pass at 91.20..
91.20 is red support line on chart, and Hi-max is pink line at 93.70.
93.70 - 91.20 = 2.50
91.20 - 2.50 = 88.70
trend down to pass 91.20, and it down to 88.70 next on technical analyze.
if down trend will pass 88.70, next it would be 84.
Next, please see highest price at April 6 2009, Aug 7 2009, and Jan 8 2010, we can line for these three points as resistance line. Then we can consider USD/JPY was not convert yet and still continue down trend.
And According to Non Farm Employment Change and Unemployment Rate, we can see USD/JPY is down trend by fundamental analyze, Unemployment Rate has been 10% three months in raw,. and Non Farm Employment Change was minus again on Dec 2009.
I am not sure exactly how long down trend is continue, although I know people expect stronger USD, Market does not follow what people expect, I still see and consider that USD/PY is down trend.
.
as I said on Facebook on last Friday, It is better to trade after we can see trend from index. and now we could see USD/JPY would be down. (sorry If I am wrong on analyze, but * please trade on your own responsibility, i wont's take any responsibility.)
First please see this pic below.

now we could see down trend, and USD/JPY down to pass at 91.20..
91.20 is red support line on chart, and Hi-max is pink line at 93.70.
93.70 - 91.20 = 2.50
91.20 - 2.50 = 88.70
trend down to pass 91.20, and it down to 88.70 next on technical analyze.
if down trend will pass 88.70, next it would be 84.
Next, please see highest price at April 6 2009, Aug 7 2009, and Jan 8 2010, we can line for these three points as resistance line. Then we can consider USD/JPY was not convert yet and still continue down trend.
And According to Non Farm Employment Change and Unemployment Rate, we can see USD/JPY is down trend by fundamental analyze, Unemployment Rate has been 10% three months in raw,. and Non Farm Employment Change was minus again on Dec 2009.
I am not sure exactly how long down trend is continue, although I know people expect stronger USD, Market does not follow what people expect, I still see and consider that USD/PY is down trend.
.
EUR USD Analyze
If we analyze USD in this year, all of us care about FRB monetary policy, especially interest rate,.
and its interest rate affect other countries' currency, today I want to post about EUR/USD.
first, let's see about interest rate of ECB and FRB.
if we back to the past, as we know, ECB follows FRB to make interest rate no matter it is up or down. ECB decided interest rate after FRB, shortest period is 4 months, longest one is 18 months, and average is 9 months.
In Sep.1998: FRB Interest Rate: Down
7months later,
In Apr.1999: ECB Interest Rate: Down
Jun. 1999 FRB UP
5 months later
Nov.1999 ECB UP
01.2001 FRB DOWN
4 months later
05.2001 ECB DOWN
06.2004 FRB UP
18 months later
12.2005 ECB UP
9.2007 FRB DOWN
13 months later
10.2008 ECB DOWN
therefore, if FRB will make interest rate up on Aug 2010,. probably ECB will make interest rate up in Dec 2010 at shortest term estimation or after 2011 at long term estimation.
As noted above, ECB followed FRB, and EUR/USD tend to be strong USD and Weak EUR just before FRB makes interest rate up as data.
For Example,.last time FRB had made interest rate UP was Jun 2004 and Jun 1999. both time started strong USD and weak EUR from a few month ago around 10%. then trend had changed strong EUR and weak USD until ECB had made intrest rate at both time in 1999 and 2004.
If this time 2010 is also according to past data, EUR/USD would be 10 % drop, then EUR/USD 1.5 could be at 1.35. and strong USD starts half years before FRB makes higher interest rate.
Finally, if FRB will make higher interest rate on Aug 2010. USD would be getting stronger since March, but EUR/USD already dropped from 1.5 since end of last year, so FRB would make higher interest rate on May or Jun 2010, or FRB would make higher interest rate in Aug, and EUR USD drops since Mar 2010, nowadays EUR/USD has been up, right? so it could be Aug. then we can analyze;
Jan to Mar EUR/USD UP to 1.5
Apr to Sep EUR/USD Down to 1.35
Oct to Dec EUR/USD UP to ?
and its interest rate affect other countries' currency, today I want to post about EUR/USD.
first, let's see about interest rate of ECB and FRB.
if we back to the past, as we know, ECB follows FRB to make interest rate no matter it is up or down. ECB decided interest rate after FRB, shortest period is 4 months, longest one is 18 months, and average is 9 months.
In Sep.1998: FRB Interest Rate: Down
7months later,
In Apr.1999: ECB Interest Rate: Down
Jun. 1999 FRB UP
5 months later
Nov.1999 ECB UP
01.2001 FRB DOWN
4 months later
05.2001 ECB DOWN
06.2004 FRB UP
18 months later
12.2005 ECB UP
9.2007 FRB DOWN
13 months later
10.2008 ECB DOWN
therefore, if FRB will make interest rate up on Aug 2010,. probably ECB will make interest rate up in Dec 2010 at shortest term estimation or after 2011 at long term estimation.
As noted above, ECB followed FRB, and EUR/USD tend to be strong USD and Weak EUR just before FRB makes interest rate up as data.
For Example,.last time FRB had made interest rate UP was Jun 2004 and Jun 1999. both time started strong USD and weak EUR from a few month ago around 10%. then trend had changed strong EUR and weak USD until ECB had made intrest rate at both time in 1999 and 2004.
If this time 2010 is also according to past data, EUR/USD would be 10 % drop, then EUR/USD 1.5 could be at 1.35. and strong USD starts half years before FRB makes higher interest rate.
Finally, if FRB will make higher interest rate on Aug 2010. USD would be getting stronger since March, but EUR/USD already dropped from 1.5 since end of last year, so FRB would make higher interest rate on May or Jun 2010, or FRB would make higher interest rate in Aug, and EUR USD drops since Mar 2010, nowadays EUR/USD has been up, right? so it could be Aug. then we can analyze;
Jan to Mar EUR/USD UP to 1.5
Apr to Sep EUR/USD Down to 1.35
Oct to Dec EUR/USD UP to ?
Subscribe to:
Posts (Atom)