we saw bad number of index on last Friday, non farm employment change and unemployment rate.
as I said on Facebook on last Friday, It is better to trade after we can see trend from index. and now we could see USD/JPY would be down. (sorry If I am wrong on analyze, but * please trade on your own responsibility, i wont's take any responsibility.)
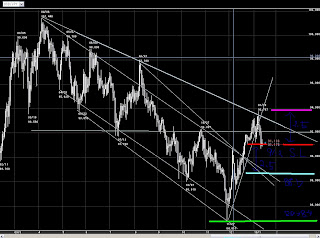
First please see this pic below.
This is 300days daily candle chart.
now we could see down trend, and USD/JPY down to pass at 91.20..
91.20 is red support line on chart, and Hi-max is pink line at 93.70.
93.70 - 91.20 = 2.50
91.20 - 2.50 = 88.70
trend down to pass 91.20, and it down to 88.70 next on technical analyze.
if down trend will pass 88.70, next it would be 84.
Next, please see highest price at April 6 2009, Aug 7 2009, and Jan 8 2010, we can line for these three points as resistance line. Then we can consider USD/JPY was not convert yet and still continue down trend.
And According to Non Farm Employment Change and Unemployment Rate, we can see USD/JPY is down trend by fundamental analyze, Unemployment Rate has been 10% three months in raw,. and Non Farm Employment Change was minus again on Dec 2009.
I am not sure exactly how long down trend is continue, although I know people expect stronger USD, Market does not follow what people expect, I still see and consider that USD/PY is down trend.
.
